Excess inventory is arguably the most unnecessary profit loss in retail. It ties up working capital, occupies valuable warehouse and selling space, and unavoidably requires markdowns, eroding margins. When 20-30% overstock levels have become the industry norm, many retailers accept these losses as the unfortunate side effect of an unpredictable market. However, those who refused to compromise had already evolved. Retailers that implemented data-driven open-to-buy (OTB) have consistently reduced overstock by 30% or more, establishing the new standard.
Key Takeaways
- Overstock costs retailers inventory value annuallythrough carrying costs, markdowns, and obsolescence (per industry research).
- Open-to-buy planning provides a frameworkfor matching anticipated demand to inventory investment, preventing both overstock and stockouts.
- Data-driven OTB incorporates real-time sales velocity, trend signals, and external factorsto adjust buying plans throughout the season.
- Successful implementationrequires integrated OTB planning, demand forecasting, allocation, and replenishment processes.
The True Cost of Retail Overstock
Carrying costs such as warehouse space, insurance, taxes, and capital charges typically consume 20-30% of inventory value annually. Beyond the surface, the intangible costs often exceed these tangible expenses. Overcrowded warehouses slow fulfillment and increase picking errors. Bloated store inventory confuses customers and reduces selling efficiency. Markdowns required to clear excess inventory create permanent margin loss. Quantifying the Overstock Problem
Consider a retailer with $10 million in average inventory and 25% overstock—that is, $2.5 million more inventory than needed to support current sales rate, totaling an annual carrying cost of $500,000 to $750,000 on this excess alone. Now add the margin erosion from inevitable markdowns (often 40-60% of original price), and the total annual cost of overstock, the cost can easily exceed $1 million for a mid-sized retailer. These are not theoretical expenses; they appear in financial statements as reduced gross margin, higher operating expenses, and constrained cash flow.
Why Traditional Buying Approaches Fail
The root of overstock stems from buying decisions made months before products reach stores or e-commerce fulfillment centers. Traditional planning relies heavily on historical sales patterns, buyer intuition, and vendor recommendations—methods that systematically overestimate demand. Common causes of overstock include buying based on optimistic sales projections, failing to account for trend shifts during long lead times, and purchasing in vendor-mandated minimum quantities that exceed actual demand.
Understanding Open-to-Buy Planning
Open-to-buy (OTB) is a planning methodology that calculates how much inventory a retailer should purchase during a specific period to achieve planned sales targets while maintaining desired inventory levels. The fundamental equation is straightforward: planned sales plus planned ending inventory minus beginning inventory minus merchandise on order equals open-to-buy. This formula ensures that buying decisions align with financial plans and anticipated demand.
The OTB Formula in Practice
Implementing OTB planning requires a framework of consistent definitions and accurate data. Beginning inventory represents the retail value of merchandise available at the start of the planning period. Planned sales reflect the financial plan’s revenue targets for the period. Ending inventory targets typically aim for a specific number of weeks of supply or a target stock-to-sales ratio. On-order merchandise includes all outstanding purchase orders with expected delivery within the planning period.
The in-season open-to-buy process extends this framework by recalculating OTB throughout the selling season as actual sales replace planned figures. This dynamic approach enables planners to adjust buying decisions based on emerging performance trends rather than following outdated, pre-season assumptions.
OTB Planning Horizons
Effective OTB spans multiple time horizons, encompassing strategic, tactical, and operational planning. Strategic OTB, typically planned 6-12 months ahead, establishes overall buying budgets by category, channel, and season. Tactical OTB, revised monthly or weekly, adjusts these budgets based on current performance and updated forecasts. Operational OTB translates budgets into specific purchase order quantities, delivery dates, and vendor allocations. Each horizon serves distinct planning needs but must connect coherently to avoid conflicting decisions.
Data-Driven OTB: Beyond the Basic Formula
Incorporating Demand Forecasting
Traditional OTB planning relies on planned sales figures derived from financial budgets and historical growth rates, treating sales plans as if they were predictions, a harmful misconception that leads to optimistic overbuying. Data-driven OTB integrates demand forecasting models to predict real customer demand based on multiple data sources: historical sales patterns, promotional calendars, seasonal factors, and external variables such as weather and economic indicators.
Sales plans and demand forecasts have critical distinctions. Sales plans represent financial targets—what the business hopes to achieve. Demand forecasts represent predicted reality—what customers are likely to buy. When forecasts fall short, data-driven OTB adjusts buying downward to prevent overstock, while sales and marketing teams may close the gap through promotional activity or traffic generation.
Real-Time Performance Monitoring
Static OTB plans quickly become obsolete when actual sales deviate from projections. On the other hand, data-driven OTB systems continuously compare actual performance simultaneously with planned figures, identifying variances and recommending appropriate adjustments. For example, A style selling 30% above plan may warrant chase orders or reallocation from slower-moving locations. A category lagging expectation may signal the need to reduce future commitments and accelerate markdown of existing inventory.
Multi-Channel Inventory Visibility
Modern retailers operate across multiple channels—wholesale accounts, owned retail stores, ecommerce sites, and marketplaces—each with distinct inventory pools but shared product supply. Effective OTB planning requires visibility across all channels to make informed buying decisions. The multi-channel planning approach enables retailers to optimize total inventory investment rather than managing each channel in isolation.
Strategies for Achieving 30% Overstock Reduction
|
Strategy |
Implementation |
Expected Impact |
|
Reduce Initial Buy Depth |
Purchase 15-20% less inventory upfront; chase winners based on early sell-through |
10-15% reduction in end-of-season overstock |
|
Dynamic OTB Recalculation |
Update buying plans weekly based on actual sales vs. forecast |
5-10% improvement in inventory alignment |
|
Size and Color Optimization |
Apply data-driven size curves and color popularity to initial allocation |
3-5% reduction in size/color imbalances |
|
Vendor Negotiation |
Secure smaller minimum order quantities and faster replenishment cycles |
5-8% reduction in forced overbuying |
|
Markdown Timing Optimization |
Trigger markdowns earlier based on sell-through velocity thresholds |
2-4% margin improvement on exit |
Strategy 1: Reduce Initial Buy Depth
There are many strategies for reducing overstock. The most effective way is to reduce the depth of initial buys. Rather than committing to a full season’s inventory upfront, retailers increasingly adopt a “test and react” approach: buying conservatively at the start of season, then chasing proven winners through reorders. According to Shopify’s OTB guide, this approach reduces overstock risk while maintaining ability to capitalize on unexpected demand.
The difficulty in this strategy lies in vendor relationships and supply chain agility. Many vendors require minimum order quantities that exceed what conservative initial buys would suggest. Overcoming this constraint requires negotiation, often trading higher unit costs for lower minimum quantities, or developing alternative suppliers willing to support smaller, more frequent orders.
Strategy 2: Implement Dynamic OTB Recalculation
The accuracy of pre-season OTB plans unavoidably deteriorates as the season progresses. A more effective approach requires weekly or bi-weekly manual OTB recalculations, incorporating actual sales, updated forecasts, and revised inventory positions. This dynamic process identifies overbought categories early, enabling planners to cancel or defer outstanding orders before inventory arrives.
Strategy 3: Optimize Size and Color Assortments
Overstock often concentrates in specific sizes or colors that sell more slowly than the style average. Traditional planning applies uniform size curves and similar color depths across styles, ignoring the reality of demand patterns. Data-driven assortment planning considers the historical size selling by category, store cluster, and even individual location to optimize size proportions. Color decisions incorporate trend analysis, historical color performance, and product-specific attributes.
Strategy 4: Improve Vendor Terms and Replenishment Speed
Overstock often results from vendor constraints: minimum order quantities, advance order requirements, and long lead times that force retailers to commit to inventory before demand signals are clear. Addressing these constraints at the source—negotiating smaller minimums, shorter lead times, and more flexible order windows—reduces the need to overbuy as insurance against uncertainty.
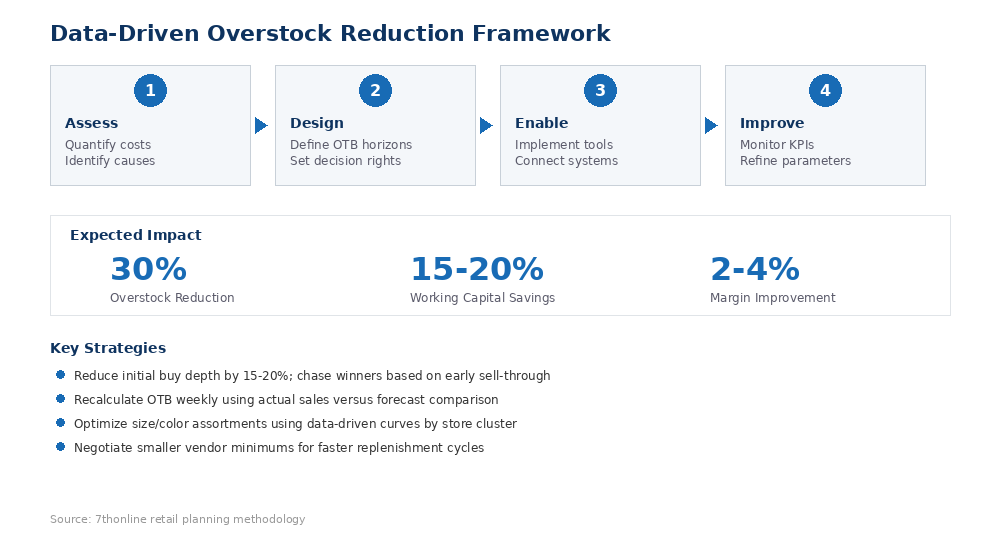
Figure 1: Data-Driven Overstock Reduction Framework
Building the Business Case for OTB Excellence
Investing in OTB planning capabilities requires resources: technology systems, data infrastructure, and skilled planners. Building the business case begins with quantifying current overstock costs using the framework described earlier. For a retailer with $50 million in annual inventory and 25% overstock, total annual overstock costs likely exceed $5 million. A 30% reduction in overstock—achievable through disciplined OTB implementation—would yield annual savings of $1.5 million or more.
Measuring OTB Effectiveness
Key performance indicators for OTB planning include stock-to-sales ratio, weeks of supply, overstock percentage (inventory above a defined age or quantity threshold), and markdown rate. The business intelligence and reporting capabilities in modern planning systems enable continuous monitoring of these metrics, identifying improvement opportunities and validating the impact of OTB initiatives.
Implementation Roadmap
Phase 1: Assessment and Baseline (Weeks 1-4)
Begin by establishing current performance baselines: overstock levels by category and channel, OTB planning processes and tools currently in use, and data availability and quality. Identify the largest overstock categories and investigate root causes. This assessment informs prioritization and resource allocation for subsequent phases.
Phase 2: Process Design (Weeks 5-8)
Design the target state OTB process, including planning horizons, update frequency, decision rights, and escalation procedures. Define the data flows required: what information is accepted into OTB calculations, frequency of data refresh, and the process outputs. Document integration requirements with related processes including demand forecasting, allocation and replenishment, and financial planning.
Phase 3: Technology Enablement (Weeks 9-16)
Select and implement OTB planning tools to support the design process. Evaluate solutions based on integration capabilities with existing systems, support for multi-channel planning, forecasting sophistication, and reporting flexibility. Plan for data migration, system configuration, and user training. Consider phased rollout by category or channel to manage risk and learn from early implementations.
Phase 4: Continuous Improvement (Ongoing)
After initial implementation, establish a rhythm of regular performance reviews and process refinement. Track OTB accuracy—the correlation between planned and actual purchases—and investigate sources of variance. Continuously improve forecasting inputs and planning parameters based on observed performance.
Frequently Asked Questions
How quickly can overstock reduction be achieved?
Typical results appear within one selling season after implementing disciplined OTB planning. Significant overstock reduction of 30% or more usually requires 2-3 seasons as planners refine forecasts, familiarize buying behaviors, and address structural constraints such as vendor terms.
Does reducing overstock increase stockout risk?
Not when implemented correctly. Data-driven OTB aims to optimize inventory levels—not simply minimize inventory. By improving forecast accuracy and enabling faster response to demand changes, well-executed OTB planning often reduces both overstock and stockouts simultaneously.
What role does technology play in OTB effectiveness?
Technology enables but does not guarantee OTB success. Systems provide the data integration, calculation automation, and reporting visibility required for effective planning. However, organizational commitment to data-driven decision making, clear accountability, and willingness to challenge historical practices prove equally important.
How should OTB planning differ for wholesale versus DTC channels?
Wholesale and DTC channels have distinct demand patterns, lead times, and service requirements. OTB planning should reflect these differences through channel-specific forecasts, different planning horizons, and tailored inventory targets. Integrated multi-channel planning ensures that inventory investment is optimized across the entire business.