A professional retail planning team needs to constantly sort through an abundance of data, consisting of point-of-sale transactions, inventory positions, customer behavior, supply chain events, and market signals. What separates a good/bad team isn’t the ability to access data, but the years of experience and intuition to filter metrics that genuinely affect business outcomes. Tracking too many indicators dilutes focus, while tracking the wrong ones leads to misguided decisions. This guide identifies five metrics that form the foundation of effective retail planning, providing clear formulas, industry benchmarks, and practical guidance for improvement.
Key Takeaways
- Inventory turnover measures how efficiently inventory converts to sales—higher turns indicate better capital efficiency enabled by abalance against in-stock requirements.
- Fill rate quantifies customer service performance—the percentage of demand fulfilled from available stock directly impacts customer satisfaction and revenue.
- Sell-through rate reveals product performance—tracking thepercentage of received inventory sold within a specific period can identify winners and losers.
- GMROI evaluates inventory profitability—measuring gross margin return on inventory investment shows whether merchandise generates adequate returns.
- Stock-to-sales ratio guides buying decisions—understanding the relationship between inventory levels and sales enables better open-to-buy planning.
Metric 1: Inventory Turnover Ratio
Definition and Formula
Inventory turnover ratio measures how many times a retailer sells and replaces inventory during a defined period. This metric provides clear insight into how effectively a business manages stock levels and order fulfillment. The standard formula divides cost of goods sold (COGS) by average inventory value:
Inventory Turnover = Cost of Goods Sold ÷ Average Inventory
For example, a retailer with $2 million in annual COGS and $500,000 in average inventory achieves four turns per year. Some retailers calculate turnover using retail value rather than cost; consistency matters more than method choice, provided the approach is applied uniformly.
Industry Benchmarks
Turnover benchmarks vary significantly by retail sector. Fast-moving consumer goods retailers may achieve 12 or more turns annually, while furniture or appliance retailers often operate at 2-4 turns. Per industry analysis, the key is comparing performance against category-specific benchmarks rather than generic retail averages. A fashion retailer at 3 turns annually likely has serious overstock issues; a luxury watch retailer at the same level may be performing well.
Improving Inventory Turnover
Higher turnover generally indicates better inventory productivity, but the pursuit of turns must not compromise customer service. Strategies for improving turnover include reducing initial buy depth, accelerating markdown cadence on slow movers, and improving demand forecasting accuracy to align purchases with actual demand. The item-level planning approach enables retailers to optimize turnover at the SKU level, identifying specific products for action rather than managing at aggregate category levels.
Metric 2: Fill Rate
Definition and Formula
Fill rate measures the percentage of customer demand fulfilled from available inventory. A 95% fill rate means that 95 out of 100 units ordered by customers were shipped from stock, while 5 units were backordered or lost. The formula is straightforward:
Fill Rate = (Units Shipped from Stock ÷ Total Units Ordered) × 100
Why Fill Rate Matters
Fill rate directly impacts customer experience and revenue. Industry research consistently ranks fill rate among the top inventory KPIs planners should track because it quantifies the customer-facing outcome of inventory decisions. Low fill rates drive away frustrated customers, damage brand reputation, and expose weaknesses to be exploited by competitors. High fill rates build customer loyalty but at the cost of higher inventory investments to reduce turnover,increasing the carrying costs.
Balancing Fill Rate and Inventory Investment
The relationship between fill rate and inventory investment follows a curve of diminishing returns. Moving from 85% to 95% fill rate typically requires moderate inventory increases. Moving from 95% to 99% often requires doubling or tripling safety stock levels, as the final percentage points address rare but unpredictable demand spikes. Smart retailers identify the optimal fill rate for each product category based on customer expectations, competitive alternatives, and product margins.
Fill Rate Variations
Several fill rate variations provide different perspectives on service performance. Line fill rate measures the percentage of order lines shipped as complete. Order fill rate measures the percentage of orders shipped in full on the first shipment. Case fill rate, common in wholesale, measures the percentage of cases shipped versus ordered. Each variation serves specific planning needs; SPS Commerce recommends selecting the variation that best reflects customer expectations in your channel.
Metric 3: Sell-Through Rate
Definition and Formula
Sell-through rate measures the percentage of received inventory that sells within a specific period. Unlike turnover, which measures overall inventory velocity, sell-through focuses on specific product receipts and their conversion to sales:
Sell-Through Rate = (Units Sold ÷ Units Received) × 100
Application in Merchandise Planning
Sell-through rate proves particularly valuable for assessing individual product, style, or category performance. A style achieving 80% sell-through in the first four weeks signals strong demand and may warrant chase orders. A style at 30% sell-through at mid-season flags potential overstock requiring markdown action. The business intelligence reporting capabilities in modern planning systems enable planners to monitor sell-through across dimensions—by store, channel, vendor, or category—to identify specific intervention opportunities.
Seasonal Context
Sell-through interpretation requires seasonal context. A 50% sell-through at mid-season may be on-plan for a category that peaks late, or concerning for a category that should be 70% through its selling window. Effective planning systems compare actual sell-through against plan rather than against absolute thresholds, enabling appropriate responses based on category-specific selling curves.
Metric 4: Gross Margin Return on Investment (GMROI)
Definition and Formula
GMROI measures the gross margin profit generated for every dollar invested in inventory. This metric combines margin performance with inventory efficiency, revealing whether inventory investment generates adequate returns. According to Investopedia, GMROI analyzes a firm’s ability to turn inventory into cash above the cost of the inventory:
GMROI = Gross Margin ÷ Average Inventory Cost
Where Gross Margin = Net Sales – Cost of Goods Sold, and Average Inventory Cost = (Beginning Inventory + Ending Inventory) ÷ 2
Benchmarks and Interpretation
Per industry analysis, a GMROI above 1.0 indicates the retailer is generating profit on inventory investment. while many businesses aim for 3.0 or higher to demonstrate strong performance, Like turnover, GMROI benchmarks vary by category: luxury goods may achieve high GMROI through margins despite lower turns, while value retailers rely on high turns to compensate for lower margins.
Using GMROI for Category Decisions
GMROI enables comparison across categories with different margin and turn profiles. A category with 50% margin and 2 turns generates GMROI of 1.0. A category with 30% margin and 5 turns generates GMROI of 1.5. Despite lower margins, the faster-turning category generates better returns on inventory investment. This insight guides allocation decisions: when inventory capital is constrained, prioritizing categories with higher GMROI improves overall profitability.
Metric 5: Stock-to-Sales Ratio
Definition and Formula
Stock-to-sales ratio expresses the relationship between inventory on hand and recent sales, typically measured in weeks of supply. This metric helps planners understand whether inventory levels are appropriate for current demand:
Stock-to-Sales Ratio = Average Inventory Value ÷ Average Weekly Sales
A ratio of 8 means the retailer holds eight weeks of inventory at current sales rates. A ratio of 4 indicates four weeks of supply.
Planning Applications
Stock-to-sales ratio serves multiple planning purposes. Pre-season, target ratios guide open-to-buy calculations, determining how much inventory to purchase to achieve desired coverage. In-season, actual ratios compared to targets reveal overbought or underbought conditions requiring action. The in-season open-to-buy process uses this ratio dynamically, adjusting buying plans via coverage calculations as actual sales are being updated.
Seasonal Adjustments
Optimal stock-to-sales ratios change throughout the year. Retailers building inventory before peak seasons may operate at 10-12 weeks of supply; the same coverage during peak selling might be 4-6 weeks. Effective planning accounts for seasonal selling curves, targeting higher ratios before demand peaks and lower ratios as seasons wind down. Uniformly applied static targets can lead to overstock in low demand periods, and stockouts in peak demand periods.
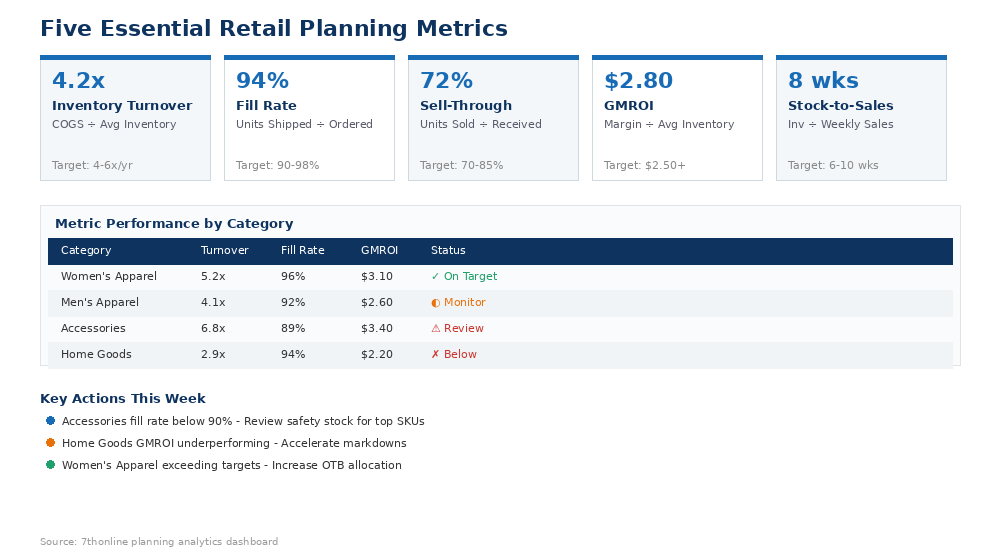
Figure 1: Five Essential Retail Planning Metrics at a Glance
Integrating Metrics for Comprehensive Planning
| Metric | Primary Use | Review Frequency |
| Inventory Turnover | Capital efficiency, overall inventory health | Monthly/Quarterly |
| Fill Rate | Customer service performance | Weekly |
| Sell-Through Rate | Product performance, markdown timing | Weekly |
| GMROI | Inventory profitability, category comparison | Monthly/Quarterly |
| Stock-to-Sales Ratio | Buying decisions, coverage planning | Weekly |
No Single Metric Tells the Complete Story
Each metric provides a partial view of inventory performance. High turnover combined with low fill rate indicates aggressive inventory management that may be costing sales. High fill rate with low GMROI indicates inventory investment that serves customers but generates inadequate returns. Comprehensive planning requires monitoring multiple metrics together, understanding their interactions, and making decisions that balance contrasting objectives.
Technology Enablement
Manually tracking these metrics across vast categories, channels, and locations quickly becomes impractical. With Modern planning systems, metric calculations are automated, generating real-time dashboards with exception alerts when metrics deviate from targets. The merchandise financial planning process integrates these metrics into planning workflows, ensuring that financial targets connect to operational metrics and that buying decisions reflect both financial and service objectives.
Building a Metrics-Driven Planning Culture
Metrics add value only when they inform decisions. Building a metrics-driven culture requires clear accountability—who owns each metric and is responsible for improvement? Regular review cadence ensures metrics stay visible and prompt action. Decision frameworks specify how metrics trigger responses: at what sell-through threshold does a style move to markdown? At what fill rate does a category require safety stock adjustment?
Transparency matters. When planning teams understand which metrics drive business outcomes and how their decisions affect those metrics, they make better choices. Dashboards that surface relevant metrics at the point of decision—during assortment reviews, OTB planning sessions, and allocation decisions—embed metrics into daily work rather than treating them as separate reporting exercises.
Frequently Asked Questions
How often should retail planning metrics be reviewed?
Review frequency should match decision cycles. Sell-through rate and stock-to-sales ratio, which inform in-season buying and allocation decisions, warrant weekly review. Inventory turnover and GMROI, which measure longer-term trends, typically suit monthly or quarterly review. Fill rate may require daily monitoring in high-velocity environments with real-time visibility.
What is a good inventory turnover ratio for retail?
There is no universal good turnover ratio—benchmarks vary dramatically by category. Fast fashion may achieve 6-8 turns annually; home furnishings may operate at 2-3 turns. Compare against category-specific benchmarks and track improvement over time rather than pursuing an arbitrary target.
How do fill rate and stockout rate relate?
Fill rate and stockout rate are complementary metrics. Fill rate measures the percentage of demand fulfilled; stockout rate measures the percentage of time inventory is unavailable. A 95% fill rate roughly corresponds to a 5% stockout rate, though the exact relationship depends on demand patterns and measurement methods.
Should metrics be tracked at category or SKU level?
Both levels provide value. Category-level metrics identify broad performance patterns and guide strategic decisions. SKU-level metrics pinpoint specific items requiring action. Modern planning systems enable drill-down from aggregate to detail, allowing planners to start with category signals and investigate underlying SKU drivers.