7thonline officially announces that leading fashion brand group Style Union has begun the full deployment of the 7thonline AI Merchandise Management Platform.
This partnership marks a significant milestone for Style Union in advancing its technological integrations. This integration reflects their long-term strategy and indicates a shift in value: intelligent merchandise management is proven valuable in an increasingly complex retail environment. By adopting 7thonline, Style Union leverages AI-driven data/insights to redesign the merchandise decision process, improve operational efficiency, and solidify the foundation for scalable growth.
About Style Union
Style Union, a fast-fashion apparel brand, quickly attracted 10 million+ customers by positioning itself for young consumers. Focusing on trend-forward easy stylings, it releases weekly new drops at very appealing price points. Its presence in the fashion industry is rapidly growing. Headquartered in India, with stores across many other regional markets, Style Union quickly doubled to 200+ brick-and-mortar stores. They are determined to secure a strong presence with continued aggressive push for more physical retail complemented by expanding e-commerce channels.
The brand offers full-category apparel for men, women, and children, including casualwear, trend-driven items, and seasonal collections. Even with weekly new product introductions, Style Union has consistently kept up with young consumers’ expectations for individuality in fashion.
Compared to traditional fast-fashion brands, Style Union’s operations enabled much faster growth by increasing product density while decreasing their refresh cycles. This rapid development has established strong brand recognition and customer loyalty within young markets. In addition, its dual expansion across offline and online channels further strengthened its regional visibility and consumer base.
Why Style Union Chose 7thonline
To support its aggressive retail expansion strategy, Style Union is leveraging 7thonline to transition away from intuition- and experience-led assortment planning. With AI-powered decision-making framework, 7thonline is codifying the Scalable Growth playbook, integrating pre-season planning with dynamic in-season deployment. This closed-loop system creates region-specific strategies and automated assortment replenishment. With 7thonline’s integration, Style Union can reliably support its aggressive operation, ensuring efficient stock turnover and ambitious store expansion plans (currently at 200+ stores). 7thonline establishes the robust foundation so Style Union can become a long-term market leader in the Indian fast-fashion sector.
A Shared Vision for the Future
Style Union’s Head of Merchandise Operations commented:
“We look forward to partnering with 7thonline not only to solve current efficiency challenges, but also to explore new possibilities for the fast-fashion industry in the era of data intelligence.”
With the help of progressive, intelligent merchandise strategies, Style Union sets the stage for the market, positioning both companies at the forefront of intelligent retail transformation.
In today’s competitive, fast-moving apparel market, there’s little tolerance for errors. Fads come and go, making any merchandise miscalculations costly. An effective and precise merchandise management strategy is now a competitive edge. One concept had become very valuable: Open-to-Buy (OTB), a critical component in securing this advantage. OTB helps retailers balance inventory, costs, and sales by using data across multiple channels, including company budgets, merchandise plans, and market demand.
This article will explore multiple aspects of OTB: how it budgets for merchandise planning, thinks multidimensionally, manages enterprises, refines operational processes, and evolves with modern technologies.
Understanding the OTB Concept
OTB, or Open-to-Buy, refers to a purchasing budget plan that determines how much a retailer is allowed to buy within a given period (often monthly). It represents the difference between planned purchases and actual purchases, decreasing as orders are placed.
With OTB, retailers can forecast monthly purchasing needs for the next 12 months based on projected sales, available capital, and inventory turnover goals. It provides critical management visibility into the right inventory levels, helping prevent overstock and slow turnover losses. Without OTB, the previously mentioned complex purchasing decisions often become guesswork and intuition.
The Relationship ofBudget, Merchandise Plan, and OTB
Budgetacts as the financial compass, defining how much the company can spend.
Merchandise planningacts as the roadmap, defining product strategy and priorities.
OTBacts as the purchasing checklist, translating strategy and budget into actionable buying decisions.
These three elements are tightly connectedand require well-balanced synchronization. Without a clear budget, merchandise plans cannot be deployed. Without a thoughtful merchandise plan, OTBs become meaningless. Without fine-tuned OTBs, budgets and plans cannot be optimally realized.
MultidimensionalInsightsConsidered ByOTB Planning
Inventory Insights
Beginning inventory (on-hand at start of period)
Target ending inventory (based on forecast and turnover)
On-order inventory (not yet received)
In-transit inventory
Cost Insights
Product acquisition cost (FOB, duties, freight)
Selling costs (marketing, commissions)
Warehousing and holding costs
Sales Insights
Forecasted sales revenue
Forecasted unit sales
KPI Insights
Markdown impact
Sell-through rate
Gross margin
Average selling price (ASP)
Average unit cost (AUC)
Weeks of supply / days of cover
Time Dimension
Historical performance over past years
Seasonality and promotional cycles
The Critical RolesOTB Plays In Enterprise Management
Precise Inventory Control
Combining multiple inputs, such as current inventory level, sales projection, and forecasted sales, to align purchases to prevent stockouts and overstock.
Cash Flow Optimization
Improve cash flow by planning purchases accurately. Helps prevent capital from being tied up in excess inventory while meeting market demand.
Lower Procurement Costs
Predict market demands to avoid unnecessary buys and returns, while assisting in improving assortment planning quality to further reduce inventory age.
Stronger Market Responsiveness
Enable quick responses to demand shifts by dynamically adjusting strategies to meet customer needs. Help secure market competitiveness while raising customer loyalty and satisfaction.
Higher Management Efficiency
Provides a systematic, data-driven purchasing framework to efficiently manage order activities. Using data analytics and advanced forecasts, businesses can plan more logically and efficiently.
Refined OTB Management Process
Budget Planning— Define financial targets based on financial goals and market demands.
Assortment Planning— Define product strategy based on various insights like brand direction and market trends.
Purchase Planning— Deploy plans based on OTB to ensure the assortment aligns with the company budget and customer tastes.
Monitor & Adjust— Continuously improve OTB based on new sales and market data to ensure consistent and effective performance.
The Application of Innovative Technology
With the continuous innovation in the retail industry, more accurate OTB plans are now possible. With advanced forecasting models and data analytics tools, it’s possible to monitor performance in real time and dynamically align inventory with demand.
How 7thonline Enables Intelligent OTB Management
The 7thonline Omnichannel AI Merchandise Management Platform leverages mathematical modeling, AI, and machine learning combined with retail best practices to automate and optimize OTB management.
In-Season Rolling OTB
Real-time updates for multidimensional data showing plan vs. actual variance
Auto-generated initial OTB plans to reduce time consumed from manual inputs and adjustments.
Multiple variants of OTB scenario simulations for different strategies and goals
Flexible planning based on the perspective of category, channel, region, and store tier
AI-powered sales forecasting uses historical data with recent sales trends, creating more data for informed decision-making.
Flexible OTB adjustment between cost-, value-, and unit-based planning perspectives
In-Season SKU Inventory Management
Real-time/Weekly tracking of new product store performance
Early alerts for potential bestseller months
Automatic linkage between OTB limits and replenishment quantities
SKU color/size-level sales forecasting
Intelligent size-level replenishment recommendations by store
Markdown and promotion scenario modeling
Conclusion
Precision is necessary in an era where overproduction and reactive planning are no longer viable; 7thonline replaces our heuristic-based intuition with algorithmic precision, ensuring safeguarded cash flow and maximizing Working Capital Efficiency. By adopting 7thonline’s intelligent OTB capabilities, brands can smoothly transition to a data-driven growth model. It synchronizes purchasing budgets with real-time market velocity, ensuring every dollar invested in inventory is positioned for maximum profitability and sustained business resilience.
In a chain retail environment, each store serves a distinctive trade area with its unique customer profiles. One of the most common challenges in retail is accounting for the various demand patterns. For example, the same product sells very differently across sizes; each store has its own distinct size-demand patterns. Misinterpreting a store’s unique pattern will decrease its performance. Missing multiple patterns, and the entire operation may be affected.
Top retail brands constantly push to reinforce their operational capabilities. They optimize inventory allocation to accurately align with real local demands. When a size distribution is optimized, it can easily increase sales, reduce markdown rates, and significantly improve profitability. Therefore, accurately analyzing and optimizing size demand by store, category, and product is critical for refined retail management. When stores carry the right size mix, they can:
Minimize sales losses from out-of-stockedpopular sizes
Reduce replenishment costs
Avoid excess inventory from slow-moving sizes
Improve full-price sell-through and margin performance
When a single-store profitability improves, the entire retail network benefits. These benefits grow much more noticeable when scaled to every store.
Strategic Precision: The Reconstructing of Unconstrained Demand
The hallmark of a high-performance retail is its optimization of effective profiles. Manual predictions can only scale so far before they hit the barrier of human capabilities, becoming difficult or even unmanageable. 7thonline moves beyond historical patterns; it reconstructs the Unconstrained Demand Profiles to recover missing data, effectively filling in the gaps where the “lost sales” were, in reality, caused by store stockouts. Leveraging multiple sophisticated operational research models, the 7thonline system syncs inventory allocation with true localized consumer demand at the store-SKU level. This transformation not only maximizes full-price sell-through, but also recaptures latent market demand that biased traditional spreadsheets often overlook.
After setting up size optimization, stores can experience:
Better supply and (real) demandalignment
Reduced stockouts in key sizes
Lower replenishment costs
Fewer leftover inventory and markdown pressure
Improved inventory flow andoptimal store profitability
Over the years, 7thonline focused on delivering tailored size-optimization consultations to numerous apparel and footwear brands, designed for each unique needs and proving the value of this approach.
Service Scope
Utilize POS data to quantify sales lost due to size breaks and markdowns, cleansing and correcting historical data patterns
Analyze store-level consumption patterns and determine optimal size ratios
Recommend optimal combinations of pre-pack sizes by category,fine-tune allocation, and replenishment efficiency
Automatically update the optimized size packs into supplier orders
Core Value
Provide storeswith tailored size mix reflecting localized patterns, improving customer satisfaction and store performance
Avoid in-season emergency replenishments, decrease costs caused by missing sizes
Lower inventory pressure from slow-moving sizes
Reduce size break occurrence (up to 15%)
Increase full-price sell-through rate (up to 14%)
Customer Success Case: Macy’s
Company Background
Macy’s, a premier U.S. department store chain widely recognized for apparel, footwear, and home goods, as well as its commitment to customer service. At the time of the project, Macy’s operated over 1,000 stores nationwide and was ranked #417 on the Fortune Global 500 list.
Project Scope
Selected 8 classifications for size optimization
Excluded 5 classifications due to insufficient data or one-size-only products
Focus on products sold at no less than 75% of full price
Analyze each classificationwith two size pack scenarios: 3-pack and 5-pack combinations
Analysis based on fall season POS data
Optimization Results
After implementing size optimization recommendations:
Average size break per style per store reduced from 2% to 4.9%
Full-price sell-through increased from 8% to 68.4%
Reduced significantlyin supply and demand miscalculation
Lower markdown rates and replenishment costs
About 7thonline
With 26 years of global retail consulting experience and industry-leading methods in merchandise management, 7thonline combines advanced data modeling and machine learning to tailor automation solutions for many business scenarios. Through its AI + BI cloud platform, 7thonline assists brands in automating merchandise planning, driving refined operations, and supporting intelligent decision-making for digital and operational transformation.
7thonline’s clients include Alexander Wang, BIRKENSTOCK, Bestseller Group, Canada Goose, PVH, Jimmy Jazz, Calvin Klein, Michael Kors, Nautica, Colony Brands, Phillips Van Heusen, VF, and many more.
As the fashion industry evolves rapidly, merchandise planning has become a core pillar of brand operations. Leading apparel brands rely on their well-structured merchandise plans to deliver products that resonate with consumers. This structure also supports coordination of resources across design, development, sourcing, production, and sales with greater efficiency.
In an era of market fragmentation, AI-integrated planning isn’t merely a competitive advantage; it has evolved into an imperative for resilient operations. However, there exists a barrier to successful implementation. Many brands still face significant challenges , including collecting, cleansing, and analyzing massive volumes of market and consumer data; planning accuracy remains a key hurdle. At the same time, keeping pace with rapid technological change to ensure systems continue to deliver value is another pressing concern.
The barrier to entry is high, but with 7thonline’sIntelligent Merchandise Planning System, you can quickly see results. Using advanced AI algorithms to break down complex data analytics, 7thonline provides a comprehensive solution for merchandise planning, enabling more accurate demand forecasts, more optimal assortment structures, more proactive supply chains, and seamless cross-departmental collaboration. With successful integration, brands can gain a stronger competitive edge in today’s dynamic markets, achieving sustainable growth.
Merchandise Planning: The Core of Fashion Enterprise Management
What Is Merchandise Planning?
Merchandise planning refers to a series of operational plans created to achieve business objectives. It spans market demand analysis, target customer profiling, category planning, pricing strategy, store inventory standards, and product selection. At its core, it is customer-driven — designed to meet consumer needs through the right products and services.
Why Is Merchandise Planning Essential?
Satisfy Customer Needs
The goal of market research and data analysis is so brands can better understand customers’ preferences. Developing products that truly align with the market demand is the essence of assortment planning.
Optimize Resource Allocations
Merchandise planning is crucial for efficiency. A well-structured plan can reduce overstock, minimize waste, and improve capital efficiency.
Secure Market Competitiveness
Distinctive assortment plans can help a brand stand out amongst competitors, while a go-to-market strategy can attract more consumers, increasing market presence and brand influence.
Achieve Strategic Goals
Merchandise planning is key for achieving annual financial and strategic objectives. Enabling a more organized, goal-oriented structure.
The Challenges Fashion Faces in Merchandise Planning
Efficiency
Large volumes of historical data require manual collection, processing, and analysis
Convoluted manual configuration of planning formulas and indicators
Easily mistakable, time-consuming validation against historical data
Accuracy
Insufficient granularity in category planning
Lack of predictive capability, which leads to inaccurate sales targets
High rates of errorsdue to the frequent need for manual adjustments
Difficulty with navigating multiple pivot tables acrossvarious planning levels
Multi-channel pricing conflicts,along with cross-regional inventory misallocation
Profitability
Infrequent inventory turnover and inefficientcapital
Frequent size breaks and stockoutsthat will affect sales of full-price merchandises
High inventory holding costs atthe end-of-season
Slow supply chain response with highprocurement costs
These data, process, talent, and market challenges are common; an intelligent merchandise planner is key. Utilizing algorithms within a unified data platform can support end-to-end processes, simplify operations, automate manual tasks, and empower planners to focus on strategic, high-value work. This will improve responsiveness, market insight, and competitiveness in rapidly changing environments.
7thonline Multi-channel AI Merchandise Management Platform
The core of the 7thonline platform is built on mathematical models, artificial intelligence, and machine learning, combining retail best practices to deliver automated solutions that deeply align with real retail scenarios. Its AI + BI cloud platform transforms data into actionable intelligence for precise merchandise decision-making.
Founded in 1999, 7thonline developed industry-leading technology and extensive retail expertise. The company has been repeatedly recognized by leading U.S. research and consulting firms as an industry leader, named one of CIO Review’s Top 20 Most Promising Retail Technology Companies, and shares industry leadership recognition alongside companies such as Oracle.
Key Product Highlights
Pre-Season Merchandise Financial Planning
System forecasts that combine historical with current sales data to predict selling trends. Break down goals and report analysis, assist strategic decisions,and optimize inventory.
Flexible planning views across category, channel, region, and store tiers
Automatic collection of merchandise, store, historical sales, and planning data, reducing time wasted by manual organization
Auto-populating planningdrafts to effectively reduce workload for manual inputs
Flexible conversionbetween cost, value, and unit to push for multidimensional merchandise planning strategy.
Pre-Season Assortment Planning
Automatic synchronization acrossthe supply chain and planning teams, enabling teams by boosting collaborative capabilities
Lifecycle sales curve simulation and weekly store inventory planning
Optimal size ratio recommendations based on historical sales in each store and category
Forecast-driven SKU-level sales and inventory decisions
Based on store dimensions, automatically recommendallocation to determine initial order quantities
In-Season SKU Inventory Management
Weekly tracking of new product performance by store KPI, adjust restock and sales strategies adaptively
Early alerts for potential bestseller months
Automated linkage between structural buying limits and replenishment quantities
Forecast SKU color and size-level salesfor stronger decision making
Markdown and promotion scenario simulation for slow movers
In-Season Rapid Replenishment Planning
VisualizedKPI dashboards across SKU, size, store, and geographic views
Different replenishment algorithms for different product types
Detailed replenishment recommendations down to style/color/size/store level
Two-weekstest sales are extracted to predict full lifecycle potential
Automatic store grouping and expansion recommendations
Flexible parameter configuration aligned with retail strategy
Serving Global Brands
With 26 years of focus on merchandise management in the fashion industry, 7thonline has supported numerous internationally recognized brands with best-in-class solutions.
Conclusion
Through its end-to-end integration of merchandise planning and execution, 7thonline sets a new benchmark for fashion retail. From strategic planning to inventory optimization and sales performance, the 7thonline multi-channel AI merchandise management platform delivers unprecedented value, enabling fashion brands to remain competitive and future-proof in an increasingly dynamic market.
Ever had excess inventory and stockouts simultaneously? Ever had declining margins? Ever felt scatterbrained over messy, fragmented Multi-Channel data? As consumer demands become erratic and trends evolve faster than ever, traditional Excel-based planning is no longer enough to keep up.
7thonline solves these painful experiences by leveraging AI; using modern methods, it reconstructs the entire merchandise management cycle. From trend insights, and design planning to in-season allocations, 7thonline uses adaptive algorithms to deliver data-driven, intelligent decisions that will reshape brands from reactive corrections to proactive planning.
Below are the 8 core capabilities that will help brands reduce costs and increase efficiency:
1. Pre-Season Merchandise Financial Planning
Using sandbox simulations to turn goals into executable plans:
Generateand draft multiple initial plans
Flexiblyorganize planning hierarchies
Cross-departmental collaboration and editing
Unifyall planning levels into a single data source
Granularity down to product attributes, store, and week
Run sandbox simulations for hypothetical scenarios
2. Pre-Season Assortment & Store Planning
Translate simulation results into efficient store-level SKU planning
Flexible planning hierarchies
Custom store clusters and individual store coverage
Collaborative editing with user tagging
Granularity down to SKU, store, and week
One-click assortment creation
AIPowered Like-style selection
Integrated management for marketing and promotions
3. Test & Buy
Use early sell-through of new products to predict broader trends
Monitor lifecycle curve
Predict trendsfrom two weeks of sales data
Recommendations and insights for store expansion
4. In-Season Allocation
Precisely match inventory to store demand
Assign specific styles to specific stores
Re-allocation trivialize delivery delays
Custom assortment bundles
Custom size packs and core size definitions
5. In-Season Replenishment & Transfer
Keep products selling in stores — not stuck in warehouses
Monitor in-season KPIs and prevent both stockouts and overstock
Automaticallyintegrate multidimensional data
Automated sell-out month alerts
One-click for plan data population
100+ built-in industry metrics
7. BI Smart Reporting
Low-code BI Reporting for fast and customizable reporting
Intuitive, user-friendly interface for report creation
No coding skills required
Pre-built metrics based on in-depthretail industry expertise
Custom formula creation
Product image display in reports
Exportable to Excel
From Best-Seller Prediction to Value Chain Reinvention
AI is restructuring the core logic of retail operations in the fashion industry. It can elevate merchandise management from a reactive hindsight-driven, “rearview mirror” strategy to a proactive, foresight-driven strategy. With the system synchronizing real-time market and anticipating future demand, making decisions quickly becomes a panoramic-like navigation experience.
The precision of algorithms can cut through the noise and complexity of modern consumer data. With it, decision cycles can shrink from months to seconds. Fashion brands can gain the strategic agility to keep pace with the market, while early adopters achieve not just operational efficiency, but also the first-mover advantage in the next era of demand-driven retailing. While competitors remain tethered to the fragmented spreadsheets, AI is ready to preemptively capture the next season’s opportunities. 7thonline’s Multi-Channel platform is the strategic engine that will redefine the synergy between people, products, and placement.
Ready to transform your merchandise management? Request a demo to see how 7thonline can help your brand stay ahead of the market.
Consumer behavior evolves faster, and market dynamics shift more frequently. Retailers are facing increasingly erratic trends that are challenging conventional operations and strategies. Businesses need solutions, and the advancement in technologies can provide. AI is creating new opportunities to address these issues.
As a professional industry solution provider for over 26 years, 7thonline focuses deeply on business-scenario automation and partners with leading retail brands. Leveraging advanced data models, machine learning, and intelligent decision capabilities, 7thonline assists retailers in better navigating today’s complexities while accelerating the progress toward technological integrations.
1. E-commerce Competition &Rising Operating Costs
The rapid growth of e-commerce is straining brick-and-mortar retailers, affecting the store sales for brands and franchise partners. These strains increase logistics costs, rent, and labor expenses have further squeezed away retail margins.
In this scenario, 7thonline assists by applying powerful data modeling and machine learning capabilities to uncover hidden market opportunities, delivering precise operational planning and optimization strategies.
Through its AI + BI + SaaS platform, 7thonline enables retailers to:
Automate core business processes
Refineoperational management
Support intelligent decision-making
Improve overall business performance
This helps retailers remain competitive despite rising costs and online competition.
2. Technological Disruption and Changing Customer Expectations
Emerging technologies will rapidly reshape retail operations. Companies unable to keep pace risk falling behind. At the same time, consumers demand better shopping experiences and more personalized offerings.
To solve these issues, 7thonline’s advanced technology platform integrates seamlessly with existing ERP systems by leveraging retailers’ POS data. With built-in business intelligence and proprietary analytical methods, 7thonline helps retailers:
Accurately interpret sales data
Intelligently forecast demandtrends
Optimize merchandise assortments
Maximizeprofitability across stores
With this, retailers can accelerate technological adoption, keep up with evolving consumer expectations, boost operational efficiency, and successfully transform workflows.
3. Brand Differentiation and Capital Pressure
In a highly saturated, competitive market, products and brands often appear similar in function and quality, differentiation for consumers will prove difficult. Meanwhile, one wrong move, and capital constraints can easily set back retailers and franchisees.
7thonline provides brands with a comprehensive merchandise planning and inventory management platform, supporting:
Financial merchandise planning
Assortment planning
Store portfolio planning
Through these capabilities, retailers can improve profitability, enhance operational efficiency, reduce inventory costs, and minimize human error.
In addition, this system strengthens the collaboration between retailers, suppliers, and partners, helping reduce procurement costs, improving supply chain efficiency, and relieve financial pressure.
Conclusion
As a business-scenario automation solution provider, 7thonline combines advanced data modeling, machine learning, and intelligent decision systems to deliver powerful support to retailers and franchise operators.
By enabling automation, refined operations, and data-driven decision-making, retailers can address many key challenges, including:
E-commerce competition
Rising operational costs
Technological disruption
Changing customer expectations
Brand differentiation difficulties
Capital pressure
Through partnership with 7thonline, retailers can improve profitability, increase operational efficiency, unlock greater business value, and enable effective digital intelligent strategies.
7thonline’s AI native Merchandise Assortment Planning solution has fundamentally transformed the role of planners – shifting from tedious, manual number-crunching to efficient, data-driven strategic decision-making. Manual work load has been slashed by over 90%, while cross-functional data silos have been eliminated. By establishing a Single Source of Truth (SSOT), we ensure 100% data integrity throughout the entire planning lifecycle. Planners now gain unprecedented capabilities for multi-dimensional analysis and multi-version scenario planning, powering business growth with a robust data engine.
I. From Manual Grind to “One-Click” Plajin Generation
Workflow / Task
Before (Manual Mode)
After (AI Mode)
Efficiency Gain
Core Plan Creation
Manually pulling sales, inventory, and promotion data from multiple, disconnected Excel sheets and BI reports, a process prone to errors and incredibly time-consuming.
AI automatically connects to all data sources and generates an initial, intelligence-backed plan with a single click.
~97%
Data Gathering & Cleansing
Exporting reports from ERP, CRM, POS systems, then manually standardizing formats, removing duplicates, and merging files.
The system automatically integrates, cleans, and consolidates data from all sources.
100% (fully automated)
Daily Adjustments & Reactions
When promotions or inventory changes hit, planners manually recalculated plans for affected SKUs – a slow and complex scramble.
Modify a key parameter (e.g., projected sales); the AI instantly recalculates all downstream plans.
~99%
Result: Planners reclaim 2-3 full workdays per week, freeing up time for high-value work like market analysis, strategy refinement, and cross-team collaboration.
II. From Data Silos to a Centralized Command Center
Experience
Before (Manual Mode)
After (AI Mode)
Key Improvement
Data Management
A fragile “forest” of 7-8 interconnected Excel files (master plan, sales history, inventory, etc.). Updating one number meant manually finding and updating all linked files, leading to inevitable errors and version chaos.
All data lives in one unified platform. Updating a key figure on a single dashboard automatically syncs across every related plan and report, guaranteeing 100% consistency.
Eliminates decision-making errors caused by bad or unsynchronized data.
Version Control
Multiple file copies with names like “Plan_FINAL_v2_updated
_REALLYFINAL.xlsx.” Comparing versions required painful manual tab-switching.
Create multiple plan versions with one click. Built-in comparison tools clearly highlight differences, enabling iterative, data-driven optimization with full audit trails.
Enables true scenario planning and traceable decision-making.
Conclusion: The workflow evolves from maintaining a fragile web of spreadsheets to managing a single, reliable source of truth – dramatically boosting both reliability and user experience.
III. From Isolated Execution to Multi-Dimensional Strategy
Capability
Before (Manual Mode)
After (AI Mode)
Business Value
Simulation & Forecasting
Manual, back-of-the-napkin calculations. Complex “what-if” scenarios involving multiple variables were virtually impossible. Decisions relied heavily on gut feeling.
Effortless “What-If” simulation: • “What if promotional sales grow by 200%?” • “What if a key supplier is delayed by 2 weeks?” The AI instantly provides quantified outcomes for each scenario.
Shifts the team from reactive firefighting to proactive risk management and opportunity planning.
Planning Granularity
Planning often stopped at the top-selling category level. Long-tail items were managed by rough rules of thumb or overlooked.
AI enables precise, SKU-level and even store-SKU-week level planning, factoring in product lifecycle, seasonality, and cross-item correlations.
Lowers overall inventory while reducing stock-outs, improving both customer satisfaction and capital efficiency.
Decision Support
Plan quality depended entirely on individual planner experience. Best practices were hard to document, standardize, or scale.
AI provides data-driven recommendations and forecasts, which planners then refine with their expert judgment and market knowledge.
Elevates overall decision quality across the team and institutionalizes knowledge into the system.
Summary
Adopting 7thonline AI native Merchandise Assortment Planning is more than a software swap—it’s a total workflow transformation:
Time: Goes from “measured in days”to “measured in minutes.”
Process:Shifts from “editing countless spreadsheets” to “managing business rules and strategies.”
Capability:Expands from “creating one static plan” to “orchestrating multiple versions and dynamic simulations.”
Ultimately, this liberates merchandise planners from repetitive tasks, empowering them to fully step into their role as Merchandise Strategists and drive greater value for business growth.
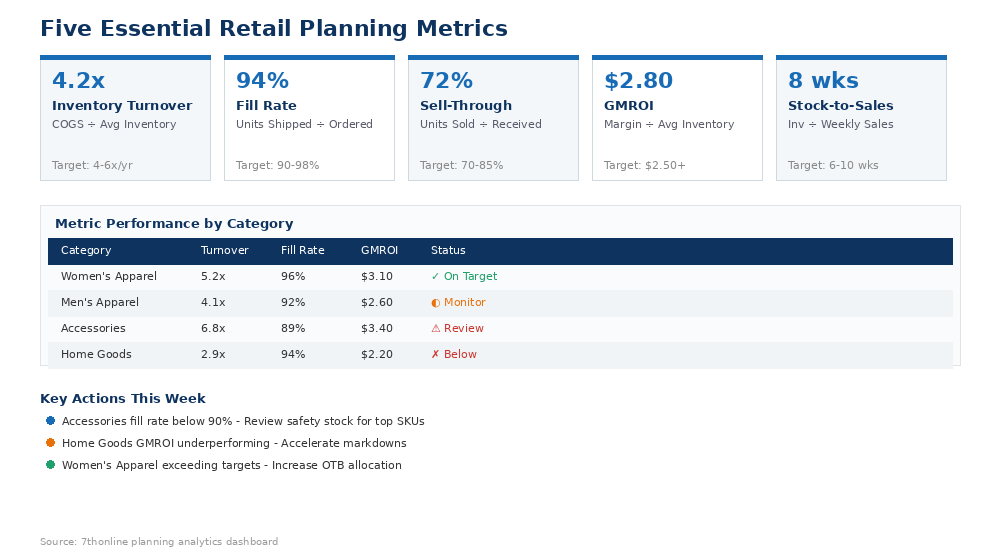
A professional retail planning team needs to constantly sort through an abundance of data, consisting of point-of-sale transactions, inventory positions, customer behavior, supply chain events, and market signals. What separates a good/bad team isn’t the ability to access data, but the years of experience and intuition to filter metrics that genuinely affect business outcomes. Tracking too many indicators dilutes focus, while tracking the wrong ones leads to misguided decisions. This guide identifies five metrics that form the foundation of effective retail planning, providing clear formulas, industry benchmarks, and practical guidance for improvement.
Key Takeaways
Inventory turnover measures how efficiently inventory converts to sales—higher turns indicate better capital efficiency enabled by abalance against in-stock requirements.
Fill rate quantifies customer service performance—the percentage of demand fulfilled from available stock directly impacts customer satisfaction and revenue.
Sell-through rate reveals product performance—tracking thepercentage of received inventory sold within a specific period can identify winners and losers.
Stock-to-sales ratio guides buying decisions—understanding the relationship between inventory levels and sales enables better open-to-buy planning.
Metric 1: Inventory Turnover Ratio
Definition and Formula
Inventory turnover ratio measures how many times a retailer sells and replaces inventory during a defined period. This metric provides clear insight into how effectively a business manages stock levels and order fulfillment. The standard formula divides cost of goods sold (COGS) by average inventory value:
Inventory Turnover = Cost of Goods Sold ÷ Average Inventory
For example, a retailer with $2 million in annual COGS and $500,000 in average inventory achieves four turns per year. Some retailers calculate turnover using retail value rather than cost; consistency matters more than method choice, provided the approach is applied uniformly.
Industry Benchmarks
Turnover benchmarks vary significantly by retail sector. Fast-moving consumer goods retailers may achieve 12 or more turns annually, while furniture or appliance retailers often operate at 2-4 turns. Per industry analysis, the key is comparing performance against category-specific benchmarks rather than generic retail averages. A fashion retailer at 3 turns annually likely has serious overstock issues; a luxury watch retailer at the same level may be performing well.
Improving Inventory Turnover
Higher turnover generally indicates better inventory productivity, but the pursuit of turns must not compromise customer service. Strategies for improving turnover include reducing initial buy depth, accelerating markdown cadence on slow movers, and improving demand forecasting accuracy to align purchases with actual demand. The item-level planning approach enables retailers to optimize turnover at the SKU level, identifying specific products for action rather than managing at aggregate category levels.
Metric 2: Fill Rate
Definition and Formula
Fill rate measures the percentage of customer demand fulfilled from available inventory. A 95% fill rate means that 95 out of 100 units ordered by customers were shipped from stock, while 5 units were backordered or lost. The formula is straightforward:
Fill Rate = (Units Shipped from Stock ÷ Total Units Ordered) × 100
Why Fill Rate Matters
Fill rate directly impacts customer experience and revenue. Industry research consistently ranks fill rate among the top inventory KPIs planners should track because it quantifies the customer-facing outcome of inventory decisions. Low fill rates drive away frustrated customers, damage brand reputation, and expose weaknesses to be exploited by competitors. High fill rates build customer loyalty but at the cost of higher inventory investments to reduce turnover,increasing the carrying costs.
Balancing Fill Rate and Inventory Investment
The relationship between fill rate and inventory investment follows a curve of diminishing returns. Moving from 85% to 95% fill rate typically requires moderate inventory increases. Moving from 95% to 99% often requires doubling or tripling safety stock levels, as the final percentage points address rare but unpredictable demand spikes. Smart retailers identify the optimal fill rate for each product category based on customer expectations, competitive alternatives, and product margins.
Fill Rate Variations
Several fill rate variations provide different perspectives on service performance. Line fill rate measures the percentage of order lines shipped as complete. Order fill rate measures the percentage of orders shipped in full on the first shipment. Case fill rate, common in wholesale, measures the percentage of cases shipped versus ordered. Each variation serves specific planning needs; SPS Commerce recommends selecting the variation that best reflects customer expectations in your channel.
Metric 3: Sell-Through Rate
Definition and Formula
Sell-through rate measures the percentage of received inventory that sells within a specific period. Unlike turnover, which measures overall inventory velocity, sell-through focuses on specific product receipts and their conversion to sales:
Sell-Through Rate = (Units Sold ÷ Units Received) × 100
Application in Merchandise Planning
Sell-through rate proves particularly valuable for assessing individual product, style, or category performance. A style achieving 80% sell-through in the first four weeks signals strong demand and may warrant chase orders. A style at 30% sell-through at mid-season flags potential overstock requiring markdown action. The business intelligence reporting capabilities in modern planning systems enable planners to monitor sell-through across dimensions—by store, channel, vendor, or category—to identify specific intervention opportunities.
Seasonal Context
Sell-through interpretation requires seasonal context. A 50% sell-through at mid-season may be on-plan for a category that peaks late, or concerning for a category that should be 70% through its selling window. Effective planning systems compare actual sell-through against plan rather than against absolute thresholds, enabling appropriate responses based on category-specific selling curves.
Metric 4: Gross Margin Return on Investment (GMROI)
Definition and Formula
GMROI measures the gross margin profit generated for every dollar invested in inventory. This metric combines margin performance with inventory efficiency, revealing whether inventory investment generates adequate returns. According to Investopedia, GMROI analyzes a firm’s ability to turn inventory into cash above the cost of the inventory:
GMROI = Gross Margin ÷ Average Inventory Cost
Where Gross Margin = Net Sales – Cost of Goods Sold, and Average Inventory Cost = (Beginning Inventory + Ending Inventory) ÷ 2
Benchmarks and Interpretation
Per industry analysis, a GMROI above 1.0 indicates the retailer is generating profit on inventory investment. while many businesses aim for 3.0 or higher to demonstrate strong performance, Like turnover, GMROI benchmarks vary by category: luxury goods may achieve high GMROI through margins despite lower turns, while value retailers rely on high turns to compensate for lower margins.
Using GMROI for Category Decisions
GMROI enables comparison across categories with different margin and turn profiles. A category with 50% margin and 2 turns generates GMROI of 1.0. A category with 30% margin and 5 turns generates GMROI of 1.5. Despite lower margins, the faster-turning category generates better returns on inventory investment. This insight guides allocation decisions: when inventory capital is constrained, prioritizing categories with higher GMROI improves overall profitability.
Metric 5: Stock-to-Sales Ratio
Definition and Formula
Stock-to-sales ratio expresses the relationship between inventory on hand and recent sales, typically measured in weeks of supply. This metric helps planners understand whether inventory levels are appropriate for current demand:
Stock-to-Sales Ratio = Average Inventory Value ÷ Average Weekly Sales
A ratio of 8 means the retailer holds eight weeks of inventory at current sales rates. A ratio of 4 indicates four weeks of supply.
Planning Applications
Stock-to-sales ratio serves multiple planning purposes. Pre-season, target ratios guide open-to-buy calculations, determining how much inventory to purchase to achieve desired coverage. In-season, actual ratios compared to targets reveal overbought or underbought conditions requiring action. The in-season open-to-buy process uses this ratio dynamically, adjusting buying plans via coverage calculations as actual sales are being updated.
Seasonal Adjustments
Optimal stock-to-sales ratios change throughout the year. Retailers building inventory before peak seasons may operate at 10-12 weeks of supply; the same coverage during peak selling might be 4-6 weeks. Effective planning accounts for seasonal selling curves, targeting higher ratios before demand peaks and lower ratios as seasons wind down. Uniformly applied static targets can lead to overstock in low demand periods, and stockouts in peak demand periods.
Figure 1: Five Essential Retail Planning Metrics at a Glance
Integrating Metrics for Comprehensive Planning
Metric
Primary Use
Review Frequency
Inventory Turnover
Capital efficiency, overall inventory health
Monthly/Quarterly
Fill Rate
Customer service performance
Weekly
Sell-Through Rate
Product performance, markdown timing
Weekly
GMROI
Inventory profitability, category comparison
Monthly/Quarterly
Stock-to-Sales Ratio
Buying decisions, coverage planning
Weekly
No Single Metric Tells the Complete Story
Each metric provides a partial view of inventory performance. High turnover combined with low fill rate indicates aggressive inventory management that may be costing sales. High fill rate with low GMROI indicates inventory investment that serves customers but generates inadequate returns. Comprehensive planning requires monitoring multiple metrics together, understanding their interactions, and making decisions that balance contrasting objectives.
Technology Enablement
Manually tracking these metrics across vast categories, channels, and locations quickly becomes impractical. With Modern planning systems, metric calculations are automated, generating real-time dashboards with exception alerts when metrics deviate from targets. The merchandise financial planning process integrates these metrics into planning workflows, ensuring that financial targets connect to operational metrics and that buying decisions reflect both financial and service objectives.
Building a Metrics-Driven Planning Culture
Metrics add value only when they inform decisions. Building a metrics-driven culture requires clear accountability—who owns each metric and is responsible for improvement? Regular review cadence ensures metrics stay visible and prompt action. Decision frameworks specify how metrics trigger responses: at what sell-through threshold does a style move to markdown? At what fill rate does a category require safety stock adjustment?
Transparency matters. When planning teams understand which metrics drive business outcomes and how their decisions affect those metrics, they make better choices. Dashboards that surface relevant metrics at the point of decision—during assortment reviews, OTB planning sessions, and allocation decisions—embed metrics into daily work rather than treating them as separate reporting exercises.
Frequently Asked Questions
How often should retail planning metrics be reviewed?
Review frequency should match decision cycles. Sell-through rate and stock-to-sales ratio, which inform in-season buying and allocation decisions, warrant weekly review. Inventory turnover and GMROI, which measure longer-term trends, typically suit monthly or quarterly review. Fill rate may require daily monitoring in high-velocity environments with real-time visibility.
What is a good inventory turnover ratio for retail?
There is no universal good turnover ratio—benchmarks vary dramatically by category. Fast fashion may achieve 6-8 turns annually; home furnishings may operate at 2-3 turns. Compare against category-specific benchmarks and track improvement over time rather than pursuing an arbitrary target.
How do fill rate and stockout rate relate?
Fill rate and stockout rate are complementary metrics. Fill rate measures the percentage of demand fulfilled; stockout rate measures the percentage of time inventory is unavailable. A 95% fill rate roughly corresponds to a 5% stockout rate, though the exact relationship depends on demand patterns and measurement methods.
Should metrics be tracked at category or SKU level?
Both levels provide value. Category-level metrics identify broad performance patterns and guide strategic decisions. SKU-level metrics pinpoint specific items requiring action. Modern planning systems enable drill-down from aggregate to detail, allowing planners to start with category signals and investigate underlying SKU drivers.
Excess inventory is arguably the most unnecessary profit loss in retail. It ties up working capital, occupies valuable warehouse and selling space, and unavoidably requires markdowns, eroding margins. When 20-30% overstock levels have become the industry norm, many retailers accept these losses as the unfortunate side effect of an unpredictable market. However, those who refused to compromise had already evolved. Retailers that implemented data-driven open-to-buy (OTB) have consistently reduced overstock by 30% or more, establishing the new standard.
Key Takeaways
Overstock costs retailers inventory value annuallythrough carrying costs, markdowns, and obsolescence (per industry research).
Open-to-buy planning provides a frameworkfor matching anticipated demand to inventory investment, preventing both overstock and stockouts.
Data-driven OTB incorporates real-time sales velocity, trend signals, and external factorsto adjust buying plans throughout the season.
Successful implementationrequires integrated OTB planning,demand forecasting, allocation, and replenishment processes.
The True Cost of Retail Overstock
Carrying costs such as warehouse space, insurance, taxes, and capital charges typically consume 20-30% of inventory value annually. Beyond the surface, the intangible costs often exceed these tangible expenses. Overcrowded warehouses slow fulfillment and increase picking errors. Bloated store inventory confuses customers and reduces selling efficiency. Markdowns required to clear excess inventory create permanent margin loss. Quantifying the Overstock Problem
Consider a retailer with $10 million in average inventory and 25% overstock—that is, $2.5 million more inventory than needed to support current sales rate, totaling an annual carrying cost of $500,000 to $750,000 on this excess alone. Now add the margin erosion from inevitable markdowns (often 40-60% of original price), and the total annual cost of overstock, the cost can easily exceed $1 million for a mid-sized retailer. These are not theoretical expenses; they appear in financial statements as reduced gross margin, higher operating expenses, and constrained cash flow.
Why Traditional Buying Approaches Fail
The root of overstock stems from buying decisions made months before products reach stores or e-commerce fulfillment centers. Traditional planning relies heavily on historical sales patterns, buyer intuition, and vendor recommendations—methods that systematically overestimate demand. Common causes of overstock include buying based on optimistic sales projections, failing to account for trend shifts during long lead times, and purchasing in vendor-mandated minimum quantities that exceed actual demand.
Understanding Open-to-Buy Planning
Open-to-buy (OTB) is a planning methodology that calculates how much inventory a retailer should purchase during a specific period to achieve planned sales targets while maintaining desired inventory levels. The fundamental equation is straightforward: planned sales plus planned ending inventory minus beginning inventory minus merchandise on order equals open-to-buy. This formula ensures that buying decisions align with financial plans and anticipated demand.
The OTB Formula in Practice
Implementing OTB planning requires a framework of consistent definitions and accurate data. Beginning inventory represents the retail value of merchandise available at the start of the planning period. Planned sales reflect the financial plan’s revenue targets for the period. Ending inventory targets typically aim for a specific number of weeks of supply or a target stock-to-sales ratio. On-order merchandise includes all outstanding purchase orders with expected delivery within the planning period.
The in-season open-to-buy process extends this framework by recalculating OTB throughout the selling season as actual sales replace planned figures. This dynamic approach enables planners to adjust buying decisions based on emerging performance trends rather than following outdated, pre-season assumptions.
OTB Planning Horizons
Effective OTB spans multiple time horizons, encompassing strategic, tactical, and operational planning. Strategic OTB, typically planned 6-12 months ahead, establishes overall buying budgets by category, channel, and season. Tactical OTB, revised monthly or weekly, adjusts these budgets based on current performance and updated forecasts. Operational OTB translates budgets into specific purchase order quantities, delivery dates, and vendor allocations. Each horizon serves distinct planning needs but must connect coherently to avoid conflicting decisions.
Data-Driven OTB: Beyond the Basic Formula
Incorporating Demand Forecasting
Traditional OTB planning relies on planned sales figures derived from financial budgets and historical growth rates, treating sales plans as if they were predictions, a harmful misconception that leads to optimistic overbuying. Data-driven OTB integrates demand forecasting models to predict real customer demand based on multiple data sources: historical sales patterns, promotional calendars, seasonal factors, and external variables such as weather and economic indicators.
Sales plans and demand forecasts have critical distinctions. Sales plans represent financial targets—what the business hopes to achieve. Demand forecasts represent predicted reality—what customers are likely to buy. When forecasts fall short, data-driven OTB adjusts buying downward to prevent overstock, while sales and marketing teams may close the gap through promotional activity or traffic generation.
Real-Time Performance Monitoring
Static OTB plans quickly become obsolete when actual sales deviate from projections. On the other hand, data-driven OTB systems continuously compare actual performance simultaneously with planned figures, identifying variances and recommending appropriate adjustments. For example, A style selling 30% above plan may warrant chase orders or reallocation from slower-moving locations. A category lagging expectation may signal the need to reduce future commitments and accelerate markdown of existing inventory.
Multi-Channel Inventory Visibility
Modern retailers operate across multiple channels—wholesale accounts, owned retail stores, ecommerce sites, and marketplaces—each with distinct inventory pools but shared product supply. Effective OTB planning requires visibility across all channels to make informed buying decisions. The multi-channel planning approach enables retailers to optimize total inventory investment rather than managing each channel in isolation.
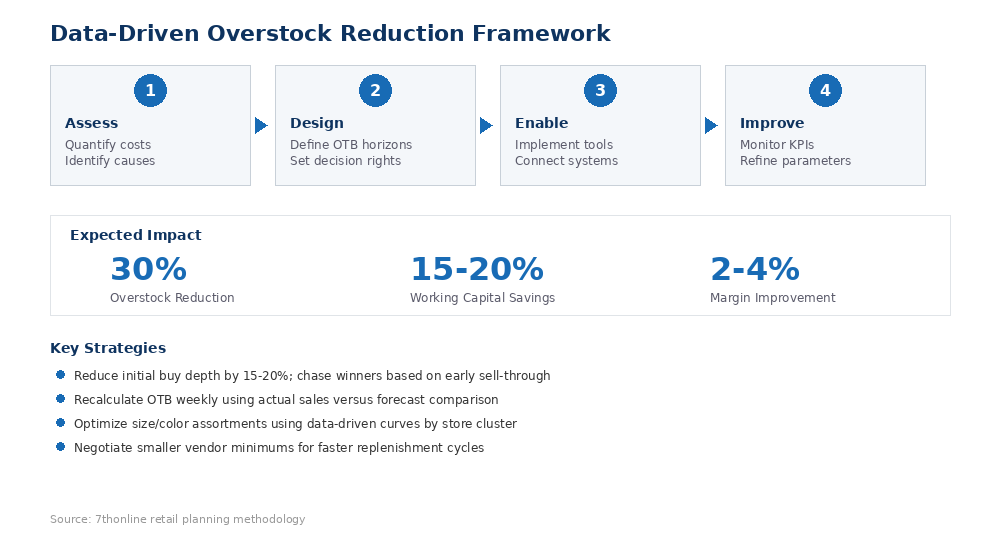
Strategies for Achieving 30% Overstock Reduction
Strategy
Implementation
Expected Impact
Reduce Initial Buy Depth
Purchase 15-20% less inventory upfront; chase winners based on early sell-through
10-15% reduction in end-of-season overstock
Dynamic OTB Recalculation
Update buying plans weekly based on actual sales vs. forecast
5-10% improvement in inventory alignment
Size and Color Optimization
Apply data-driven size curves and color popularity to initial allocation
3-5% reduction in size/color imbalances
Vendor Negotiation
Secure smaller minimum order quantities and faster replenishment cycles
5-8% reduction in forced overbuying
Markdown Timing Optimization
Trigger markdowns earlier based on sell-through velocity thresholds
2-4% margin improvement on exit
Strategy 1: Reduce Initial Buy Depth
There are many strategies for reducing overstock. The most effective way is to reduce the depth of initial buys. Rather than committing to a full season’s inventory upfront, retailers increasingly adopt a “test and react” approach: buying conservatively at the start of season, then chasing proven winners through reorders. According to Shopify’s OTB guide, this approach reduces overstock risk while maintaining ability to capitalize on unexpected demand.
The difficulty in this strategy lies in vendor relationships and supply chain agility. Many vendors require minimum order quantities that exceed what conservative initial buys would suggest. Overcoming this constraint requires negotiation, often trading higher unit costs for lower minimum quantities, or developing alternative suppliers willing to support smaller, more frequent orders.
Strategy 2: Implement Dynamic OTB Recalculation
The accuracy of pre-season OTB plans unavoidably deteriorates as the season progresses. A more effective approach requires weekly or bi-weekly manual OTB recalculations, incorporating actual sales, updated forecasts, and revised inventory positions. This dynamic process identifies overbought categories early, enabling planners to cancel or defer outstanding orders before inventory arrives.
Strategy 3: Optimize Size and Color Assortments
Overstock often concentrates in specific sizes or colors that sell more slowly than the style average. Traditional planning applies uniform size curves and similar color depths across styles, ignoring the reality of demand patterns. Data-driven assortment planning considers the historical size selling by category, store cluster, and even individual location to optimize size proportions. Color decisions incorporate trend analysis, historical color performance, and product-specific attributes.
Strategy 4: Improve Vendor Terms and Replenishment Speed
Overstock often results from vendor constraints: minimum order quantities, advance order requirements, and long lead times that force retailers to commit to inventory before demand signals are clear. Addressing these constraints at the source—negotiating smaller minimums, shorter lead times, and more flexible order windows—reduces the need to overbuy as insurance against uncertainty.
Investing in OTB planning capabilities requires resources: technology systems, data infrastructure, and skilled planners. Building the business case begins with quantifying current overstock costs using the framework described earlier. For a retailer with $50 million in annual inventory and 25% overstock, total annual overstock costs likely exceed $5 million. A 30% reduction in overstock—achievable through disciplined OTB implementation—would yield annual savings of $1.5 million or more.
Measuring OTB Effectiveness
Key performance indicators for OTB planning include stock-to-sales ratio, weeks of supply, overstock percentage (inventory above a defined age or quantity threshold), and markdown rate. The business intelligence and reporting capabilities in modern planning systems enable continuous monitoring of these metrics, identifying improvement opportunities and validating the impact of OTB initiatives.
Implementation Roadmap
Phase 1: Assessment and Baseline (Weeks 1-4)
Begin by establishing current performance baselines: overstock levels by category and channel, OTB planning processes and tools currently in use, and data availability and quality. Identify the largest overstock categories and investigate root causes. This assessment informs prioritization and resource allocation for subsequent phases.
Phase 2: Process Design (Weeks 5-8)
Design the target state OTB process, including planning horizons, update frequency, decision rights, and escalation procedures. Define the data flows required: what information is accepted into OTB calculations, frequency of data refresh, and the process outputs. Document integration requirements with related processes including demand forecasting, allocation and replenishment, and financial planning.
Phase 3: Technology Enablement (Weeks 9-16)
Select and implement OTB planning tools to support the design process. Evaluate solutions based on integration capabilities with existing systems, support for multi-channel planning, forecasting sophistication, and reporting flexibility. Plan for data migration, system configuration, and user training. Consider phased rollout by category or channel to manage risk and learn from early implementations.
Phase 4: Continuous Improvement (Ongoing)
After initial implementation, establish a rhythm of regular performance reviews and process refinement. Track OTB accuracy—the correlation between planned and actual purchases—and investigate sources of variance. Continuously improve forecasting inputs and planning parameters based on observed performance.
Frequently Asked Questions
How quickly can overstock reduction be achieved?
Typical results appear within one selling season after implementing disciplined OTB planning. Significant overstock reduction of 30% or more usually requires 2-3 seasons as planners refine forecasts, familiarize buying behaviors, and address structural constraints such as vendor terms.
Does reducing overstock increase stockout risk?
Not when implemented correctly. Data-driven OTB aims to optimize inventory levels—not simply minimize inventory. By improving forecast accuracy and enabling faster response to demand changes, well-executed OTB planning often reduces both overstock and stockouts simultaneously.
What role does technology play in OTB effectiveness?
Technology enables but does not guarantee OTB success. Systems provide the data integration, calculation automation, and reporting visibility required for effective planning. However, organizational commitment to data-driven decision making, clear accountability, and willingness to challenge historical practices prove equally important.
How should OTB planning differ for wholesale versus DTC channels?
Wholesale and DTC channels have distinct demand patterns, lead times, and service requirements. OTB planning should reflect these differences through channel-specific forecasts, different planning horizons, and tailored inventory targets. Integrated multi-channel planning ensures that inventory investment is optimized across the entire business.
Match supply to demand; the concept may be straightforward, but it is a fundamental challenge all retailers must face. Too much inventory ties up capital and leads to markdowns; too little results in lost sales and disappointed customers. Traditional forecasting methods—spreadsheets, historical averages, and intuition—no longer suffice in an era of rapidly shifting consumer preferences, omnichannel complexity, and supply chain volatility. The market evolved, and so should retailers. With AI-driven demand forecasting emerging, it is quickly becoming the definitive solution, applying machine learning algorithms to deliver unprecedented accuracy and operational agility.
Key Takeaways
AI-driven demand forecasting reduces inventory costs by 15-25% within 12 monthsby improving prediction accuracy and enabling proactive inventory decisions (per industry research).
Machine learning models process millions of data pointsacross channels, categories, and external factors to identify patterns human planners cannot detect.
Real-time forecasting enables in-season agility, allowing retailers to adjust buying decisions as market conditions evolve.
Implementation requires more than technology—success depends on data quality, organizational readiness, and integration with existing planning workflows.
The Evolution of Retail Demand Forecasting
Demand forecasting has progressed through distinct phases over the past several decades. Early approaches relied heavily on simple moving averages and seasonal adjustments, with planners manually adjusting numbers based on experience and market knowledge. The introduction of enterprise resource planning systems in the 1990s brought more sophisticated statistical methods, including exponential smoothing and ARIMA models. However, these systems remained constrained by their reliance on historical data patterns and their inability to incorporate external variables at scale.
Limitations of Traditional Forecasting Methods
Conventional forecasting approaches share several critical weaknesses that limit their effectiveness in modern retail environments. First, they assume that past patterns will continue into the future—a dangerous assumption when consumer behavior shifts rapidly due to social media trends, economic conditions, or competitive actions. Second, traditional models struggle to handle the complexity of omnichannel retail, where the same product may sell differently across wholesale accounts, direct-to-consumer stores, and ecommerce platforms.
According to research published in Science Direct, a study analyzing over 1.6 million stock keeping units (SKUs) found that classical forecasting methods consistently underperformed compared to machine learning approaches, particularly for products with irregular demand patterns or limited historical data. The research demonstrated that AI-based models could significantly improve stockout prediction accuracy by incorporating a broader range of variables and learning complex non-linear relationships.
Why Machine Learning Changes the Equation
Machine learning transforms demand forecasting by applying algorithms that learn from data rather than following predetermined rules. These systems continuously improve as they process more information, adapting to changing market conditions without requiring manual recalibration. The key advantage lies in their ability to identify subtle patterns and interactions among hundreds of variables simultaneously—something no human planner can accomplish effectively and consistently.
Modern AI forecasting systems incorporate data sources that traditional methods could not practically process: weather forecasts, social media sentiment, local events, competitor pricing, economic indicators, and real-time sales velocity across channels. By analyzing these factors simultaneously, machine learning models can generate predictions that account for the full complexity of consumer demand.
How AI Demand Forecasting Works
Data Integration and Processing
Effective AI forecasting begins with comprehensive data integration. Machine learning models require access to multiple data streams, including historical sales transactions, inventory positions, pricing history, promotional calendars, and product attributes. External data—weather patterns, economic indicators, local events, and social media trends—adds contextual richness that improves prediction accuracy.
The 7thNucleus AI engine exemplifies this approach by unifying data across wholesale, DTC retail, and ecommerce channels into a single forecasting model. This integrated view enables the system to identify demand signals that would remain invisible when channels are analyzed in isolation—for example, recognizing that strong wholesale performance for a particular style predicts upcoming consumer demand for related products in direct retail.
Algorithm Selection and Model Training
Different forecasting scenarios require different algorithmic approaches. Time series models such as LSTM (Long Short-Term Memory) networks excel at capturing seasonal patterns and trend continuation. Gradient boosting methods like XGBoost perform well for products with strong promotional effects or price sensitivity. Deep learning architectures can incorporate unstructured data such as product images and descriptions to predict demand for new items without historical sales records.
Model training involves feeding historical data to the algorithm and adjusting parameters to minimize prediction error. Sophisticated systems employ ensemble methods that combine multiple models, selecting the best-performing approach for each product or category. Retail-specific AI platforms go further by embedding domain knowledge into the modeling process—for example, incorporating merchandising calendars, size curves, and color popularity trends that generic machine learning tools would not recognize.
Continuous Learning and Adaptation
Unlike static forecasting models that require periodic manual updates, AI systems learn continuously from new data. Each sales transaction, inventory adjustment, and forecast error provides feedback that refines future predictions. This adaptive capability proves particularly valuable during periods of erratic market conditions, such as economic disruptions or viral product trends, where historical patterns become unreliable predictors.
Benefits of AI-Driven Demand Forecasting
Improved Forecast Accuracy
The most direct benefit of AI forecasting is improved prediction accuracy. According to industry analysis, while results vary by retailer and category, organizations implementing machine learning forecasting may see 20-40% reductions in forecast error compared to traditional methods,. Higher accuracy translates directly into better inventory decisions: fewer stockouts, reduced overstock, and more efficient use of working capital.
Operational Efficiency Gains
AI forecasting automates many tasks that previously occupied a planner’s time—data gathering, model adjustment, exception identification, and report generation. This automation allows planning teams to focus on high-value activities such as strategic assortment decisions, vendor negotiations, and cross-functional collaboration. Organizations implementing AI forecasting report significant reductions in planning cycle times, enabling faster response to changing market conditions.
Enhanced Omnichannel Coordination
Modern retailers operate across multiple channels—wholesale accounts, owned retail stores, ecommerce sites, and marketplaces—each with distinct demand patterns and inventory requirements. AI forecasting systems designed for omnichannel retail can model these channels together, identifying opportunities to balance inventory across the network. The multi-channel planning capabilities embedded in advanced platforms enable retailers to optimize total inventory investment while maintaining service levels across all selling channels.
Proactive Decision Making
Traditional forecasting provides point estimates of future demand. AI systems go further by generating scenario analyses, confidence intervals, and early warning signals. Planners receive additional alerts when actual sales diverge from forecasts, when inventory positions require attention, or when external factors suggest upcoming demand shifts. This proactive intelligence enables faster, more informed decision making throughout the planning cycle.
Figure 1: Key Benefits of AI-Driven Demand Forecasting in Retail Operations
Implementation Considerations
Data Quality and Governance
AI forecasting accuracy depends fundamentally on data quality. Incomplete transaction records, inconsistent product hierarchies, and delayed inventory updates all degrade model performance. Organizations pursuing AI forecasting must establish robust data governance practices: standardized product taxonomies, reliable data pipelines, and clear accountability for data quality metrics. The investment in data infrastructure often determines whether AI forecasting delivers meaningful results.
Integration with Existing Systems
AI forecasting does not operate in isolation—it must connect to merchandise planning, inventory management, and replenishment systems to translate predictions into actions. Integration complexity varies significantly depending on existing technology architecture. Retailers with modern, API-based platforms can implement AI forecasting relatively quickly, while those with legacy systems may require substantial middleware development or system replacement.
The unified planning platform approach addresses this challenge by embedding AI forecasting within an integrated suite of planning applications. This architecture eliminates integration barriers and ensures that forecasting insights flow directly into assortment planning, open-to-buy management, and allocation decisions.
Organizational Change Management
Technology alone does not improve forecasting outcomes. Successful AI implementation requires organizational change: new skills for planning teams, revised processes that incorporate AI insights, and leadership commitment to data-driven decision making. Organizations that treat AI forecasting as a technology project rather than a business transformation often fail to realize its full potential.
Training programs should help planners understand how to interpret AI outputs, when to override model recommendations, and how to provide feedback that improves model performance. Clear governance frameworks define accountability for forecast accuracy and establish escalation paths when disagreements arise between model predictions and planner judgment.
AI Forecasting Applications Across the Planning Cycle
Planning Phase
AI Application
Business Impact
Pre-Season Planning
Demand prediction for new products using similarity analysis
Reduced risk on initial buys, better size/color mix
In-Season Management
Real-time forecast updates based on sales velocity
Faster reorder decisions, reduced markdowns
Promotional Planning
Lift prediction for promotions and markdowns
Optimized promotional depth and timing
Allocation
Channel and location-level demand prediction
Better inventory placement, higher sell-through
Replenishment
Dynamic safety stock and reorder point optimization
Reduced stockouts, lower carrying costs
Emerging Trends in AI Forecasting
Generative AI for Scenario Planning
The emergence of generative AI has opened new possibilities for demand forecasting. Large language models can synthesize information from news sources, earnings calls, and social media to identify demand signals that structured data analysis might miss. Generative AI also enables natural language interfaces to forecasting systems, allowing planners to ask questions and receive explanations in conversational form.
Federated Learning for Privacy-Preserving Collaboration
Retailers increasingly collaborate with suppliers and partners on demand planning, but data sharing raises privacy and competitive concerns. Federated learning techniques allow AI models to learn from distributed data sources without centralizing sensitive information. This approach enables retailers and suppliers to jointly improve forecast accuracy while maintaining data confidentiality.
Edge Computing for Real-Time Processing
Traditional AI forecasting runs in centralized cloud environments, with data uploaded from stores and warehouses for batch processing. Edge computing brings AI inference closer to the point of decision—enabling real-time demand sensing at individual store locations. This capability proves particularly valuable for perishable goods, fast fashion, and other categories where hours matter.
Choosing an AI Forecasting Solution
Selecting the right AI forecasting platform requires careful evaluation of several factors. First, consider the vendor’s retail expertise: generic AI tools may offer impressive technology but lack understanding of merchandise planning workflows, retail calendars, and category-specific demand patterns. Second, evaluate integration capabilities: the forecasting system must connect seamlessly with existing planning and inventory management tools. Third, assess scalability: can the platform handle growth in SKUs, channels, and transaction volume without performance degradation?
Retail-specific AI platforms offer advantages over generic machine learning tools. As Bernard Marr notes, retailers increasingly seek analytics solutions designed for their industry’s unique challenges—solutions that embed domain knowledge alongside algorithmic sophistication. The demand planning capabilities in specialized retail platforms reflect this principle, combining advanced machine learning with retail-specific features such as size curve optimization, new product similarity matching, and promotional lift modeling.
Frequently Asked Questions
How accurate is AI demand forecasting compared to traditional methods?
AI demand forecasting typically reduces forecast error by 20-40% compared to traditional statistical methods, though results vary by retailer, category, and implementation quality. The greatest improvements appear in categories with complex demand patterns, significant promotional activity, or multiple selling channels.
What data is required to implement AI forecasting?
Effective AI forecasting requires historical sales data, inventory records, product attributes, and promotional calendars at minimum. Additional data sources—weather, economic indicators, social media, competitor pricing—improve accuracy but are not strictly required to begin. Data quality matters more than data volume: clean, consistent records for two to three years typically suffice for initial implementation.
How long does it take to implement AI demand forecasting?
Implementation timelines range from three to twelve months depending on data readiness, system integration complexity, and organizational change requirements. Retailers with modern planning systems and clean data can achieve initial results in weeks; those requiring data infrastructure development or legacy system integration may need significantly longer.
Can AI forecasting handle new products with no sales history?
Yes. AI systems address the new product challenge through similarity matching—identifying existing products with comparable attributes and using their demand patterns as predictors. Advanced systems incorporate product images, descriptions, and attribute data to find similar items even when explicit product relationships are not defined.