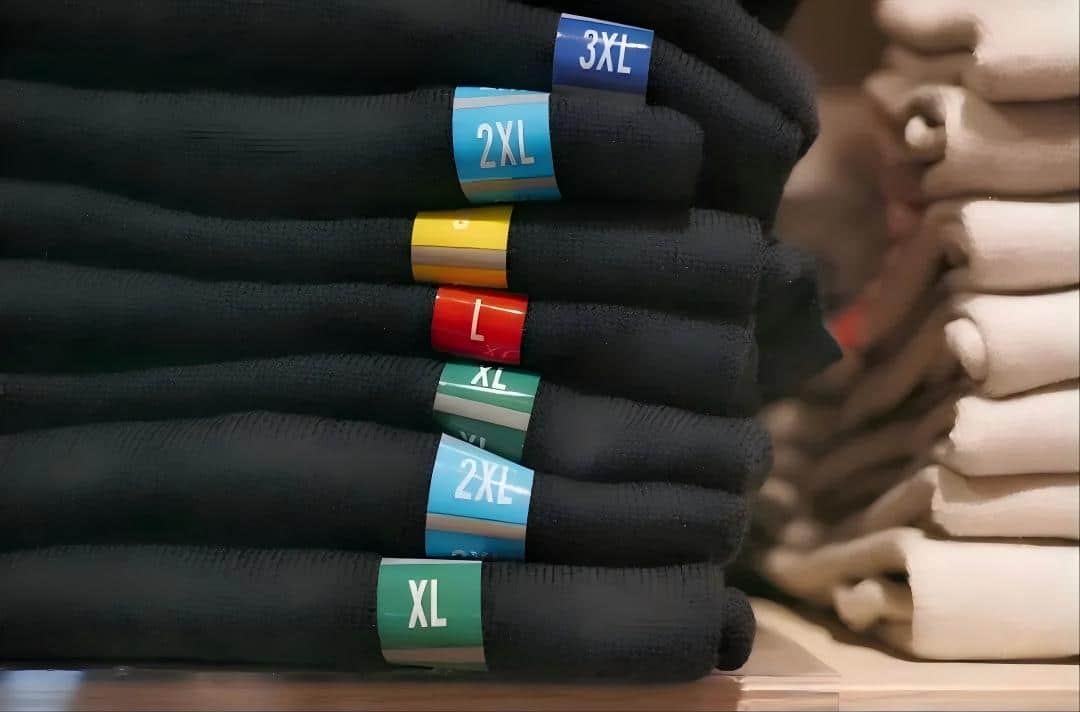
Most merchandise teams agree on one thing: when a product does not sell, the style itself is often part of the problem. But in real retail operations, another issue is often overlooked. The same product can perform very differently from store to store. One location may sell out of core sizes quickly, while another keeps sitting on inventory.
For example, size M sells out early while sizes L and XL keep piling up. Size 42 needs repeated replenishment, while sizes 41 and 43 continue to accumulate. The same item may sell quickly in one region and move slowly in another. Products like these are difficult to classify simply as “good sellers” or “poor sellers.” The issue is not always the style. Often, the size mix is not aligned with the store’s actual customer base.
When the size ratio does not match real demand, a typical pattern appears: stockouts and overstock happen at the same time. In many cases, what gets wasted is not just slow-moving inventory. It is also the sales opportunity that could have been captured if the right sizes had been available.
-
The Three Core Challenges of Size Management
Challenge 1: Stockouts and Overstock Exist at the Same Time
Most retailers still rely on an experience-based standard size curve. In other words, they allocate size quantities based on historical average ratios. The problem is that averages often hide real demand, especially differences across customer groups.
Take women’s pants as an example. A common industry size distribution might be S/M/L/XL = 20%/35%/30%/15%. But in actual operations, a small change in style can shift this ratio significantly. For a style aimed at a more mature female customer, size M may approach or even exceed 40%, while size S may be much lower. If a brand uses one generic size curve for allocation, the outcome is usually predictable: core sizes sell out early, while non-core sizes gradually build up. Overall sell-through may look acceptable on the surface, but once the data is broken down by size, the problem becomes clear.
Challenge 2: Regional Differences Make Experience-Based Size Curves Unreliable
The customer structure in the Chinese market varies more than many brands initially expect. The same product often shows stable shifts in size distribution across different regions: North versus South, tier-one cities versus lower-tier markets, and even different trade areas within the same city. If a brand uses one national size structure for all stores, it is essentially using an average to cover multiple demand distributions. The result will naturally be inaccurate. This is usually not a store execution issue. It is a front-end allocation issue that failed to account for customer differences.
Challenge 3: The Hidden Cost of Size-Related Returns and Exchanges Is Often Underestimated
Size problems do not only lead to unsold inventory. Many brands discover during review that size-related returns and exchanges account for a meaningful share of total returns. The bigger issue is that the cost is layered. Returned products need to be received, checked, restocked, and redistributed. Each step creates additional operational cost. There is also a customer experience cost that is easier to overlook. When the size does not fit, customers rarely see it as a normal inconvenience. They are more likely to lose confidence and leave.
-
The Real Nature of Size Optimization: More Granular Demand Forecasting

Size problems are often described as structural mismatches. But if we trace the result backward, the deeper issue is that demand forecasting for a single style was not broken down to the size level.
Size management is still a merchandise planning problem. It simply operates at a finer level of detail.
The traditional approach is: historical sales ratio → standard size allocation → unified national stocking.
The optimized approach is: style-level forecast × size structure model × regional body profile → differentiated size stocking.
A more effective approach separates size as its own decision layer. How much a style will sell, how that demand breaks down by size, and how different regions should be allocated are not the same question. A complete size optimization logic requires three layers of forecasting. If any one layer is missing, the size structure is likely to drift.
-
Four Key Actions for Size Optimization
Action 1: Build a Historical Data Foundation at the Size Level
Many brands do not lack data. The issue is that the data cannot be used effectively.
Common problems include inconsistent SKU coding, messy size fields, inconsistent color definitions, and incomplete historical data. As a result, when teams reach the analysis stage, it becomes difficult to break the data down clearly by size.
The first step is often not building a model. It is cleaning up the foundational data. Only when style, size, region, and channel can be aligned does the analysis become meaningful.
Action 2: Build Regional Body Profiles
Regional differences are not a matter of intuition. They can be seen in the data.
Historical sales data can usually reveal relatively stable size distributions by region. In actual operations, however, several details matter:
- Whether store segmentationis appropriate, including trade area, customer profile, and price band.
- Whether the data period covers a complete selling cycle.
- Whether different categories are analyzed separately.
If these details are not handled properly, the regional profile itself can become biased.
Action 3: Dynamically Adjust Size Structure In-Season
Size optimization is not something that can be completed once before the season starts.
In-season transfers based on sell-through are already a common retail practice. In execution, the problem is often speed:
- Stores may be reluctant to transfer stock.
- Decisions move slowly and miss the selling window.
- System inventory and actual inventory may not match.
The key is not only whether the brand has data. It is whether the organization can keep pace with the selling cycle.
Action 4: Establish a Size Efficiency Evaluation System
Looking only at overall sell-through can easily hide the problem.
A more useful view is the gap between sizes, especially whether sell-through is balanced across sizes.
Brands typically need to monitor several indicators:
- Whether core sizes frequently run out of stock.
- The sell-throughgap between different sizes.
- Returns and exchanges related to size issues.
These indicators provide a more direct view of structural size problems.
-
How 7thonline Enables Precise Size Optimization
The method behind size optimization is not complicated. The hard part is executing it consistently in real business operations. Once SKU count, store scale, and regional differences are layered together, it becomes very difficult for manual work to manage all variables at the same time. This is why many brands introduce systems-level support for merchandise decision-making.
7thonline’s Merchandise Management System focuses on three key capabilities at the size level:
-
A Pre-Season Size Structure Planning Engine
Before ordering, the system breaks down historical sales by style, size, store, and channel instead of looking only at total sales.
This changes the planning process in several ways:
- Brands no longer use one standard size curve for the entire country. Different regions can have different size structures.
- Teams can see in advance how size ratios differ for a style between North China and South China.
- Core sizes are less likely to be under-allocated from the beginning.
The value of this layer is not that the calculation becomes more complex. It is that structural differences that were previously invisible are exposed earlier.
-
Regionally Differentiated Allocation
During allocation, the system supports size distribution by region and store group, instead of pushing one unified ratio to all stores.
Compared with the traditional approach, the difference is clear:
- It is not simply about adjusting a ratio. It combines historical sell-through with allocation logic.
- The same product can have different size structures in different cities or even different store groups.
- It helps prevent the repeated pattern where some stores are always missing sizes while others keep sitting on excess sizes.
On this basis, the system can further refine size allocation down to the single-store, single-style-color level, making the size structure closer to the actual customer base.
-
In-Season Dynamic Transfer and Reordering
Once the selling cycle begins, size structure will inevitably shift. The key question is whether the brand can adjust in time.
The system continuously tracks sell-through and inventory changes by region and size, helping teams identify:
- Which sizes are starting to run out.
- Which sizes are building up in specific regions.
- Whether the right action is transfer or replenishment.
Compared with manual judgment, the biggest difference is that the system can view inventory and demand across the entire network at the same time, rather than only looking at a single store or a single region.
The purpose of this step is to pull structural mismatches back as early as possible, instead of waiting until the end of the season for the problem to fully surface.
What the system can solve is clarity and early visibility.
To turn that visibility into results, merchandise, supply chain, and store teams still need to work together.
But given the complexity of today’s business environment, without system-level support, many structural issues are difficult to see at all.
The Profit Case for Size Optimization
The return on size optimization is direct. Every one-point reduction in stockout loss translates into direct sales growth. Every one-point reduction in return rate creates structural savings in operating cost. Every day of faster inventory turnover improves capital efficiency.
Taken together, systematic size optimization can help brands improve profit by 2 to 4 percentage points. This is not a nice-to-have. It is the basic efficiency dividend of more refined merchandise management.
Final Thoughts
Size optimization is not a new concept, but it remains one of the areas that many brands understand yet still struggle to execute.
The bottleneck is usually not awareness. It is foundational capability:
Is the data clean?
Is the method stable?
Can execution keep up?
Systems can amplify these capabilities, but only if the capabilities themselves exist.
When a brand can manage size, one of the smallest units of merchandise detail, with precision, its upstream supply chain response, downstream customer experience, and inventory turnover efficiency all improve. Size is where refined merchandise management begins.